
RESEARCH & STATISTICS · DESNZ 2026 RELEASE
UK lighting energy statistics
Electricity use and the cost of keeping the lights on.
Lighting accounted for an estimated 18.98 TWh, or 22.8% of UK services electricity, in 2025. Explore the 2022–2025 figures and calculate what that demand would cost at different unit prices.
Explore the numbers ↓
of services electricity is used for lighting.
01 / THE ENERGY PICTURE
How much electricity does lighting use?
Compare lighting with other electricity uses across UK services. This includes commercial and public services; it does not represent every UK business or the whole economy.
| End use | TWh | Share |
|---|---|---|
| Other | 26.67 | 32.1% |
| Lighting | 18.98 | 22.8% |
| Cooling and ventilation | 11.14 | 13.4% |
| Computing | 8.64 | 10.4% |
| Space heating | 8.00 | 9.6% |
| Cooking/catering | 7.97 | 9.6% |
| Water heating | 1.70 | 2.0% |
A CHART TO REFERENCE
Lighting compared with other electricity uses
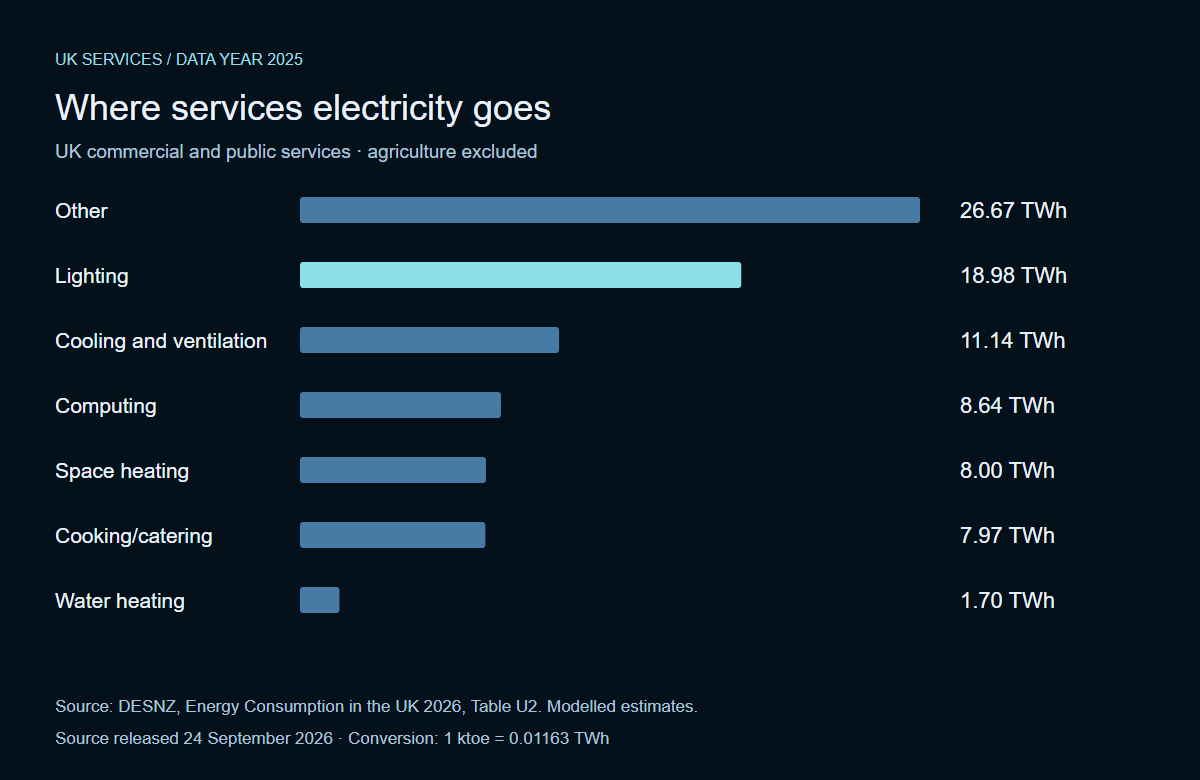
Suggested attribution: DESNZ, Energy Consumption in the UK 2026, Table U2; chart and calculations by Lumenloop. Include the data year and sector scope when quoting a figure.
02 / PUT A PRICE ON THE POWER
What would that lighting electricity cost?
Use the selected year’s lighting demand to explore the effect of a unit price. These are calculated equivalents, not measured national spending or quoted tariffs.
The reduction is your assumption, not a forecast or an LED savings claim. Actual results depend on existing equipment, operating hours and controls.
ANNUAL ENERGY COST EQUIVALENT · 2025
£4.75bnEnergy charge only. Excludes standing charges, VAT and other bill components.
At this scale, every 1p/kWh changes the annual cost equivalent by £189.8 million.
READING THE NUMBERS
What do these lighting statistics mean?

Why does a 2026 report show 2025 data?
The source was released on 24 September 2026 and reports annual estimates through 2025. The date on each chart identifies the year measured, not the publication year. The explorer also includes 2022–2024 from that same release.
Does 22.8% apply to every business?
Lighting is a substantial electricity end use across services. That makes installed power, operating hours and controls useful starting points when reviewing lighting demand in an individual building.
The national share is not a benchmark for every premises. An office, a hotel and a warehouse have different operating patterns. Assess the actual installation before estimating a saving.
Does this include industrial lighting?
Industry is deliberately excluded from this lighting comparison: the source groups industrial lighting with appliances, so it cannot support a lighting-only total.
How can I estimate my own lighting cost?
Annual lighting electricity in kWh = installed watts ÷ 1,000 × operating hours. Multiply by your unit price in pounds per kWh. Use the office lighting energy calculator for a building-level scenario, or see the UK business energy statistics report for wider sector context.
03 / OPEN DATA, CLEAR ASSUMPTIONS
Download the lighting data and sources
Publicly available statistics, with the underlying values available to download.
Download the data · CSV ↓UK services electricity by end use, 2022–2025
CSV prepared by Lumenloop: 28 observations across seven end uses. Columns: year, use, ktoe and twh. The file contains the underlying electricity estimates and converted TWh values; illustrative cost scenarios are not included.
Source and scope
DESNZ: Energy Consumption in the UK 2026, published 24 September 2026. End Use tables, Table U2; services electricity, 2022–2025. Agriculture and the source’s combined overall total are excluded.
What these figures measure
These are modelled end-use estimates, not a new meter survey. Services allocations draw on the Building Energy Efficiency Survey. Values and historical estimates can be revised in subsequent releases.
How we calculate
1 ktoe = 0.01163 TWh. Lighting share = lighting electricity ÷ the sum of the seven services end uses. Cost equivalent = TWh × 1 billion kWh × selected pence/kWh ÷ 100. Calculations use unrounded values.
Original DESNZ workbook ↗Published 29 October 2026 · Source data released 24 September 2026.