UK final energy consumption by sector
Source: DESNZ ECUK 2025, Consumption Table C1. Percentages are Lumenloop calculations from sector totals.
DESNZ ECUK 2025 records a 3.8% rise in services energy consumption in 2024, while industry fell to its lowest level for more than 50 years. A June 2026 DESNZ update also signals a larger role for industrial lighting and electrical appliances in the official end-use tables.
DESNZ ECUK 2025 records total UK final energy consumption at 128.1 mtoe in 2024. Services and other final users used 20.6 mtoe, industry used 19.5 mtoe, and services lighting accounted for 1,530 ktoe of electricity use.
Use the charts below with the source notes from DESNZ Energy Consumption in the UK 2025 and the June 2026 industrial end-use update. For Lumenloop commercial context, see commercial lighting upgrades, lighting controls and office lighting energy calculations.
Source: DESNZ ECUK 2025, Consumption Table C1. Percentages are Lumenloop calculations from sector totals.
Source: DESNZ ECUK 2025, Consumption Table C1. Bar length is scaled to the 2000 industrial electricity value.
ECUK 2025 records services and other final users at 20.6 mtoe in 2024, up from 19.8 mtoe in 2023.
Industry fell 1.2% to 19.5 mtoe, the lowest industrial consumption level recorded in the ECUK narrative for over 50 years.
The services end-use table models lighting at 1,530 ktoe, around 17.8 TWh, equal to 22.8% of services electricity use in that table.
DESNZ's provisional June 2026 method adds 937 ktoe to the 2024 industrial lighting estimate before ECUK 2026 is finalised.

This report uses DESNZ Energy Consumption in the UK 2025 as the main source for UK final energy consumption, commercial energy consumption and industrial energy use. ECUK splits demand by final user, fuel and end use, so it is useful for comparing the services sector with industry, transport and domestic energy demand.
For broad UK business energy use, the closest official ECUK groups are industry and services and other final users. They are not a perfect definition of every business premises, but together they show how much energy is used outside domestic homes and transport fuel before the data moves into more detailed building-level sources.
The end-use tables are especially useful for lighting energy use in the UK because they separate electricity used for lighting, cooling and ventilation, computing, heating and other services loads. Those figures are modelled, not metered from every building, so the page keeps the published ECUK 2025 numbers separate from the provisional June 2026 industrial update.
The June 2026 DESNZ special feature matters because it proposes a new industrial end-use method for ECUK 2026. The clearest finding is the size of the provisional lighting and electrical appliances uplift: the 2024 industrial lighting estimate would rise by 937 ktoe before final ECUK 2026 figures are confirmed.
ECUK says services energy intensity increased from 183 to 188 ktoe per unit of output between 2023 and 2024. That is still close to the lowest levels in the series, but the direction matters: lower prices, slightly cooler weather and building use can pull demand back up even when equipment has become more efficient.
In electricity terms, the services end-use table is a useful proxy for commercial buildings because it includes the everyday loads found in offices, retail, education, hospitality and other service-sector premises. Lighting is the second-largest named electricity end use in the 2024 table, behind the broad other category. That is why the figure belongs beside practical pages on office lighting, retail lighting and warehouse and industrial lighting, not just in an energy statistics table.
For lighting projects, this is the practical reading: commercial buildings need efficient luminaires, sensible controls and product choices that do not create avoidable replacement work later.
Source: DESNZ ECUK 2025, End Use Table U2. The services end-use split uses BEES-derived assumptions and modelled estimates.
The old ECUK industrial end-use reference table had been broadly unchanged for more than 10 years. DESNZ now plans to use updated research for ECUK 2026, including new end-use estimates for bioenergy and waste and heat.
That is why this page treats the June 2026 release as a data story in its own right. The final published ECUK 2025 table still records industrial lighting and appliances at 217 ktoe in 2024, but the provisional update would move the figure much closer to a major electrical end use.
Source: DESNZ ECUK 2025 Table U1 and June 2026 Energy Trends special feature, Annex 2. The provisional update is not yet the final ECUK 2026 table.
It turns a dry methodology note into a practical signal: the official model for industrial end uses is catching up with modern plant, electrical loads and fuel mixes.
The previous industrial end-use reference table had been used in broadly unchanged form for over a decade.
DESNZ proposes to use detailed Spanish industrial end-use research as a proxy where UK-specific research is missing.
In the provisional electricity reference table, lighting and electrical appliances range from 4.4% to 36.1% across SIC divisions.
DESNZ plans a flat-file industrial end-use time series for the five most recent years from ECUK 2026 onward.
The source data points to a measured position. Space heating, transport fuel and industrial heat dominate UK energy use. But in commercial and industrial buildings, lighting remains a sizeable electrical end use, and it is easier to specify, meter, control and replace than many embedded building loads.
That matters for office refurbishments, school upgrades, retail rollouts, warehouse lighting and wider commercial lighting replacement work. The strongest projects combine efficient luminaires with zoning, occupancy control, daylight response where appropriate and product choices that keep future replacement waste under control.
| Metric | Value | Plain-English reading | Source |
|---|---|---|---|
| Total final UK energy consumption | 128.1 mtoe | About 1,490 TWh across all final users in 2024. | ECUK 2025 Table C1 |
| Services and other final users | 20.6 mtoe | Up 3.8% from 2023 to 2024. | ECUK 2025 Table C1 |
| Industry final energy consumption | 19.5 mtoe | Down 1.2% from 2023 to 2024. | ECUK 2025 Table C1 |
| Services electricity | 6,699 ktoe | About 77.9 TWh in the services end-use table. | ECUK 2025 Table U2 |
| Services lighting electricity | 1,530 ktoe | About 17.8 TWh, or 22.8% of services electricity. | ECUK 2025 Table U2 |
| Current industrial lighting and appliances | 217 ktoe | The current ECUK 2025 industrial end-use estimate for 2024. | ECUK 2025 Table U1 |
| Provisional industrial lighting uplift | +937 ktoe | Indicative June 2026 change before ECUK 2026 is finalised. | DESNZ June 2026 special feature |
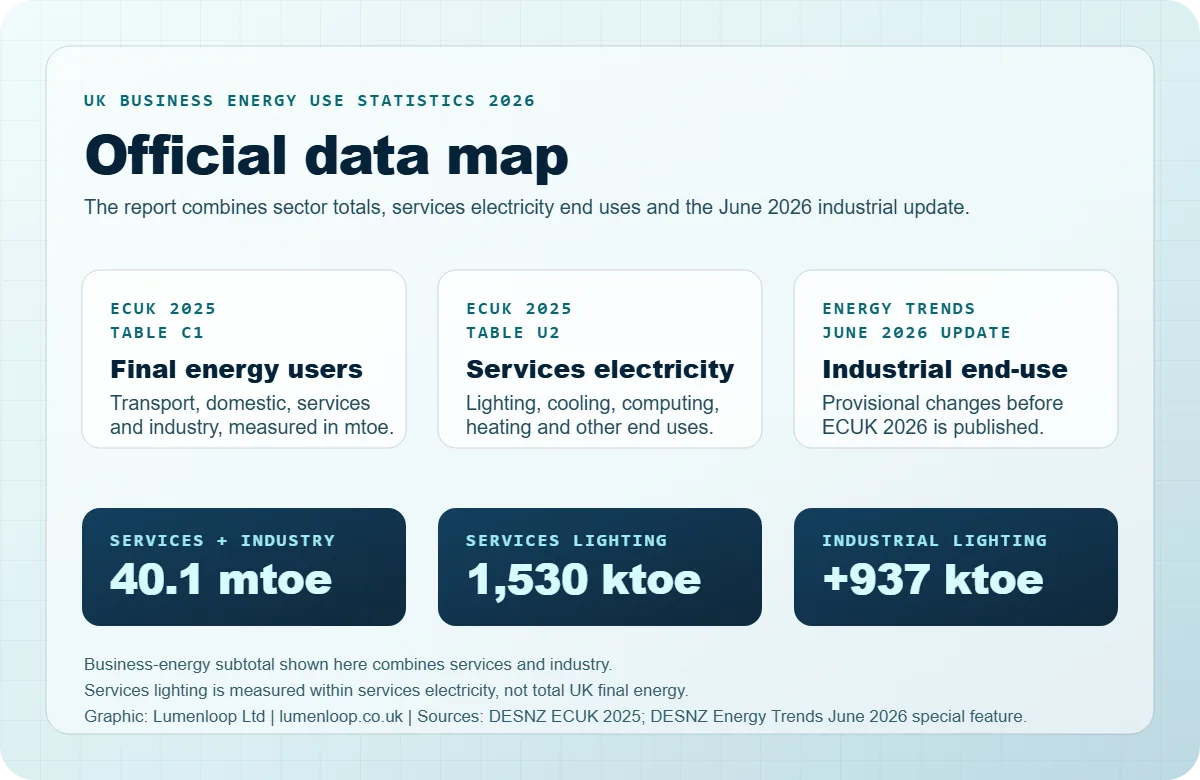
In ECUK 2025, services and other final users used 20.6 mtoe in 2024 and industry used 19.5 mtoe. Together that is about 40.1 mtoe, or roughly 466 TWh, before domestic and transport demand are counted.
The closest ECUK 2025 sector group for broad commercial energy demand is services and other final users, recorded at 20.6 mtoe in 2024. For building-level detail, DESNZ ND-NEED should be used alongside ECUK.
ECUK 2025 Table U2 models services lighting at 1,530 ktoe in 2024. That is around 17.8 TWh and 22.8% of services electricity in the end-use table.
DESNZ set out a proposed ECUK 2026 industrial end-use method using newer research. The indicative 2024 change adds 937 ktoe to lighting and electrical appliances across fuels, but DESNZ says the final results may differ.
Download the chart files and the working source table used for this report.
Visual explanation of how ECUK final-user, fuel and end-use tables are used.

Final UK energy consumption split by transport, domestic, services and industry.

Services electricity end uses from DESNZ ECUK 2025 Table U2.

ECUK 2025 industrial lighting figure and the June 2026 provisional uplift.
CSV containing the values, units and source notes used on this page.
The CSV is a reporting aid. It does not replace the official DESNZ tables.
All figures on this page come from official DESNZ publications, with Lumenloop calculations marked in chart notes and tooltips.
For chart files, source notes, methodology questions or interview requests, contact Lumenloop directly. The downloads above include the figures used in this report.