Executive summary
The policy signal is targeted. The waste risk is not.
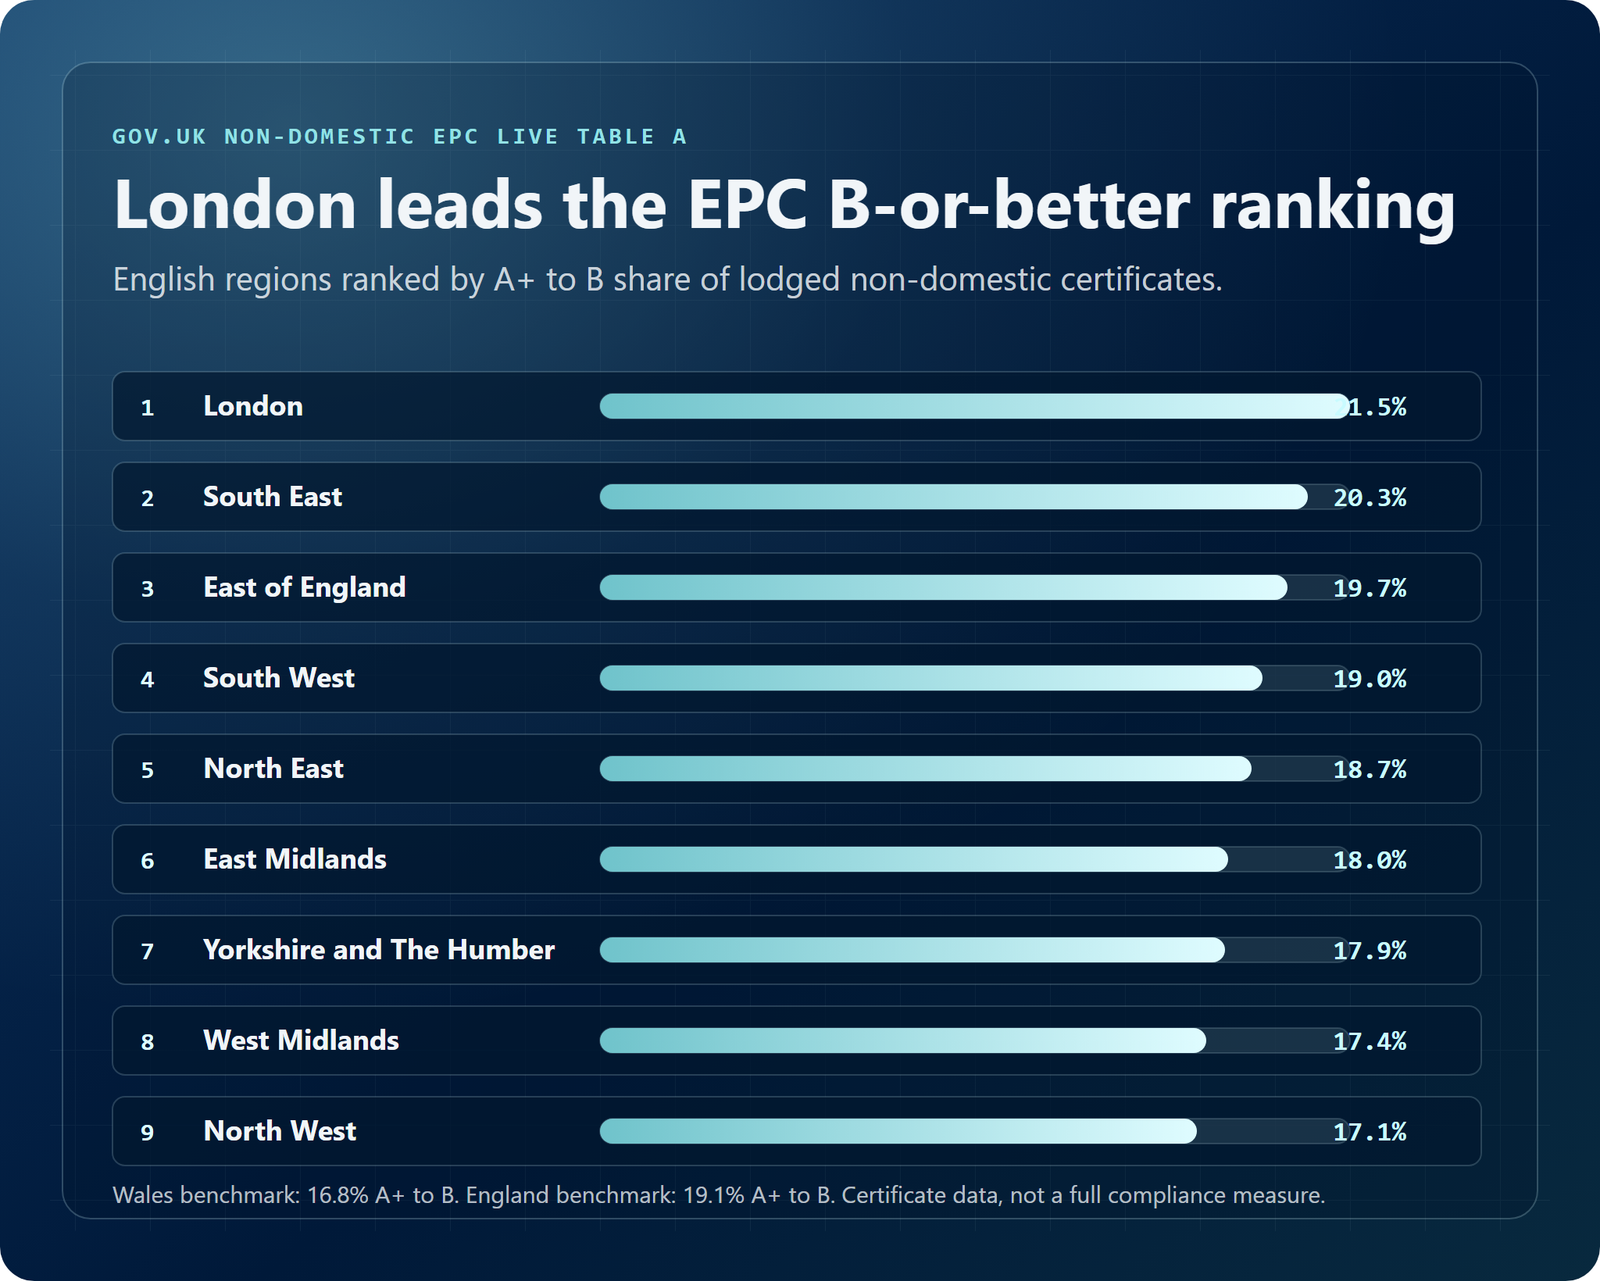
Policy
EPC B is proposed, not live law.
The current legal minimum for privately rented non-domestic property remains EPC E. EPC B from 2031 still needs secondary legislation.
Energy
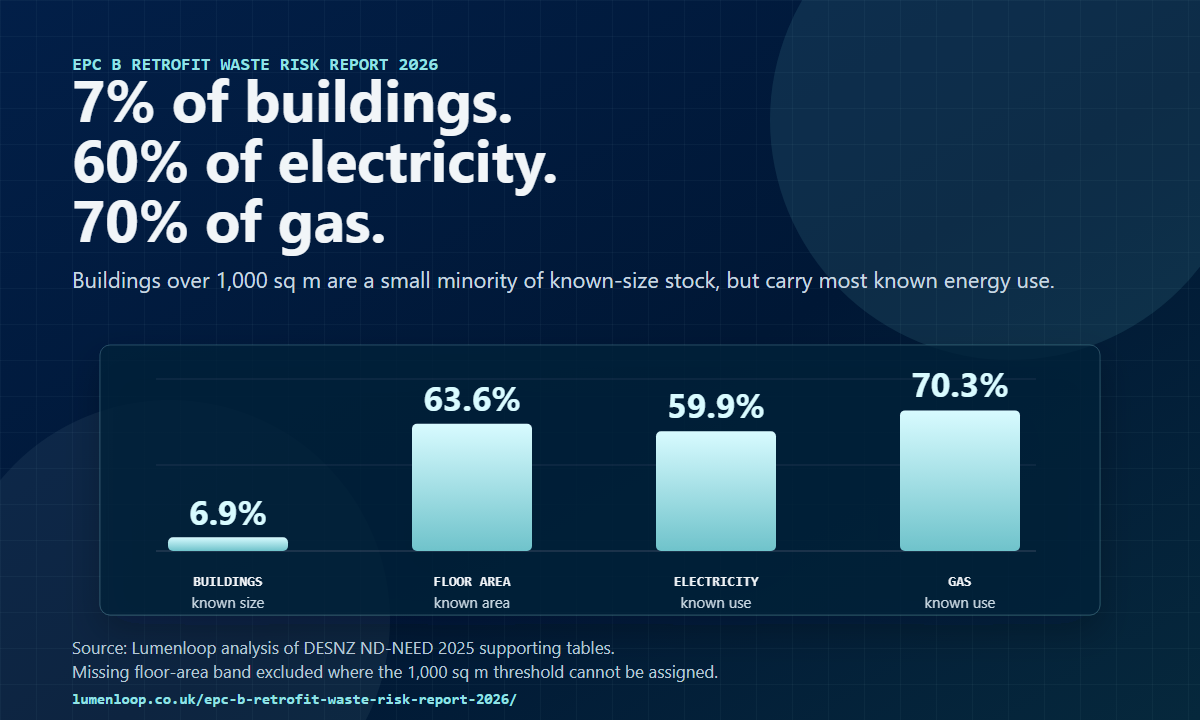
Large buildings dominate known use.
Buildings above 1,000 sq m account for 59.9% of known electricity use and 70.3% of known gas use in ND-NEED 2025.
Waste
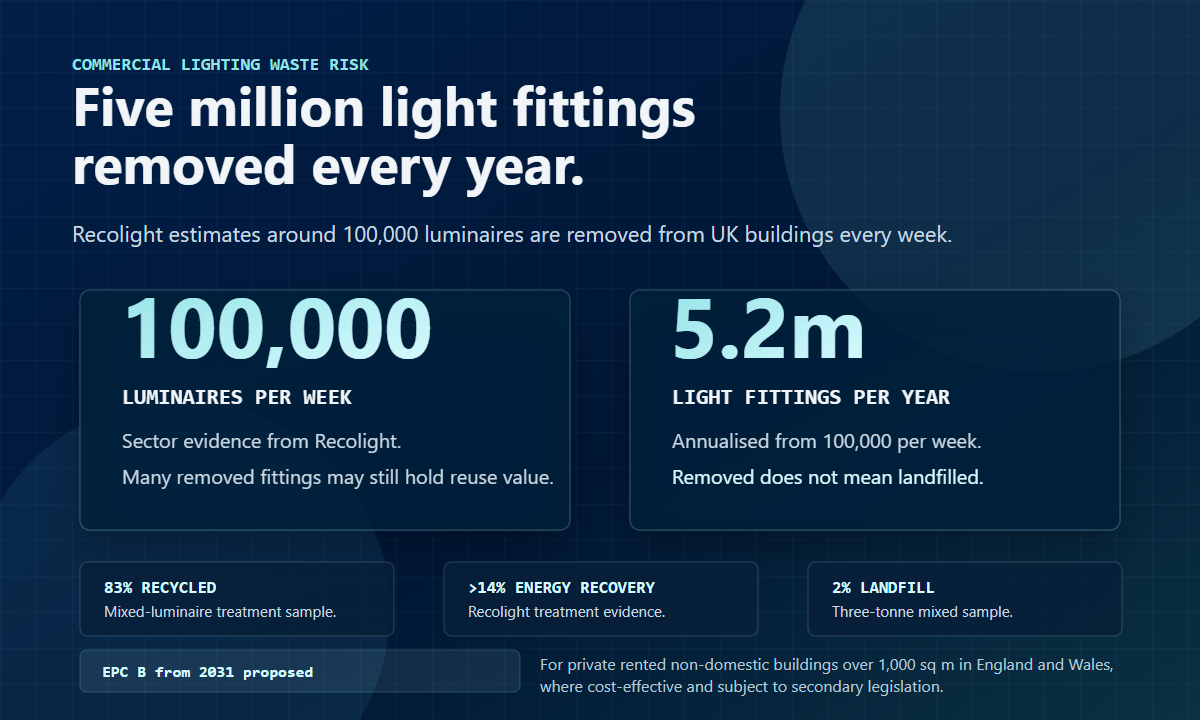
Removed fittings already number in the millions.
Recolight estimates around 100,000 luminaires are removed from UK buildings every week, many in reusable condition.
Retrofit
Repairability belongs in the project requirement.
The risk is not retrofit itself. It is whole-fitting replacement where drivers, optics, controls or bodies could be retained or serviced.
Lumenloop's conclusion is careful: EPC-led retrofit could create avoidable lighting waste if repairability, reuse and circularity are left out of the specification.


