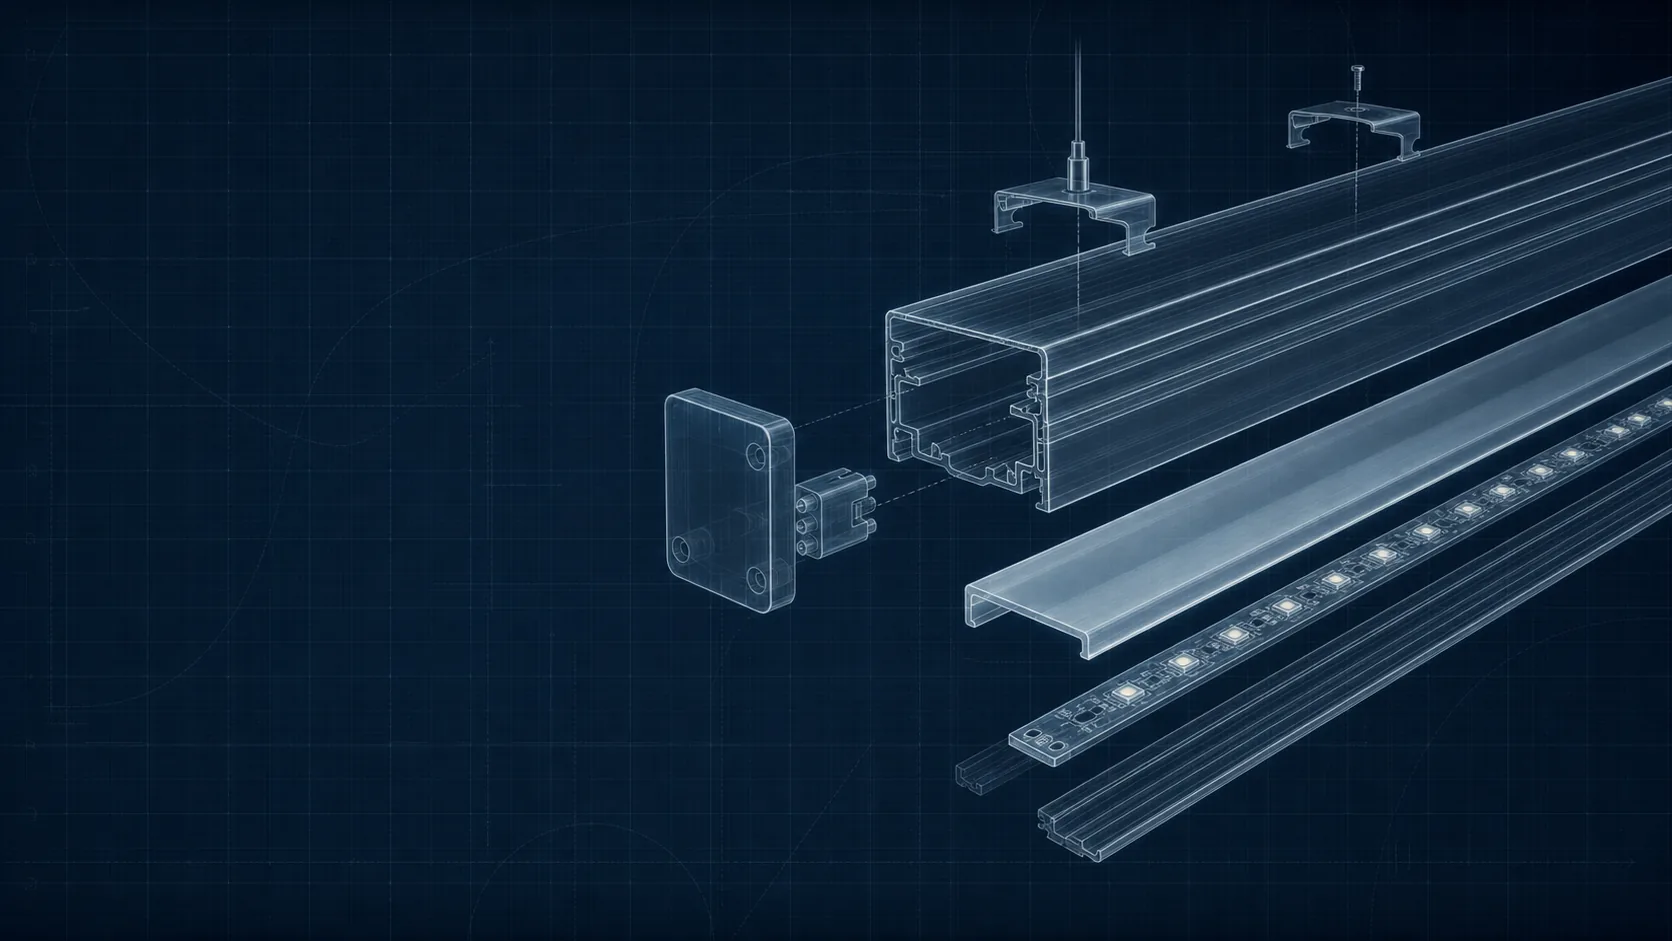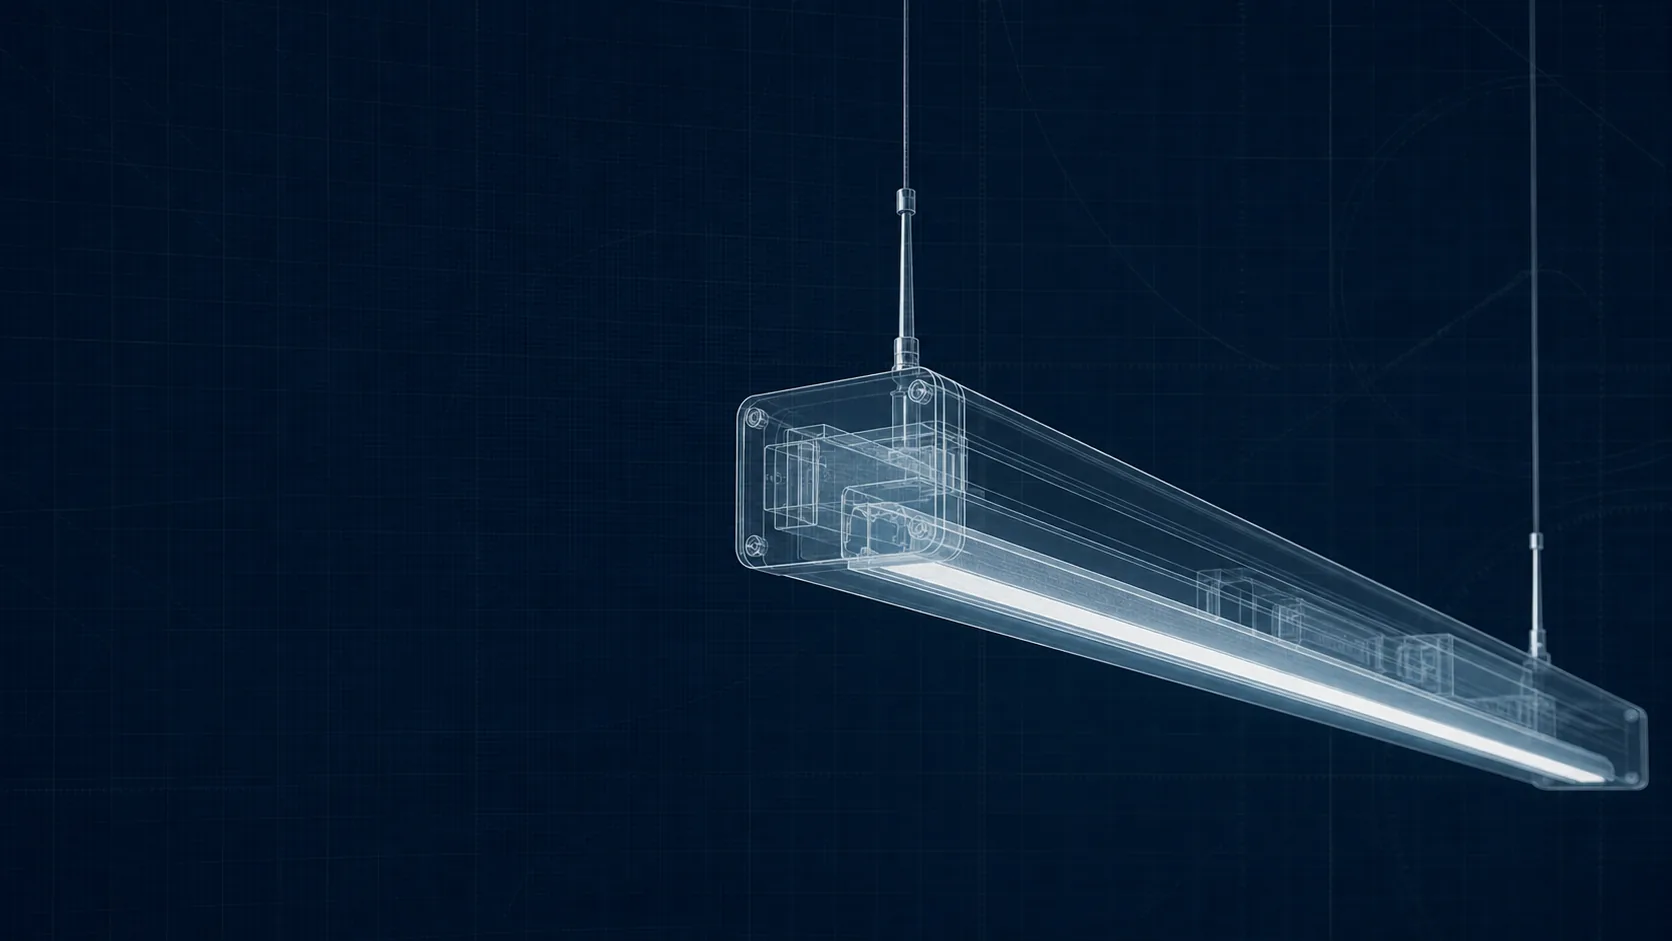
Specification choices
Configure luminaires around the project specification.
Select output, colour temperature, beam angle, CRI, fitting type, emergency options and the correct control gear before requesting a quotation.
Lumen output 3000K + colour High CRI DALI / Casambi Bluetooth
Lumen output
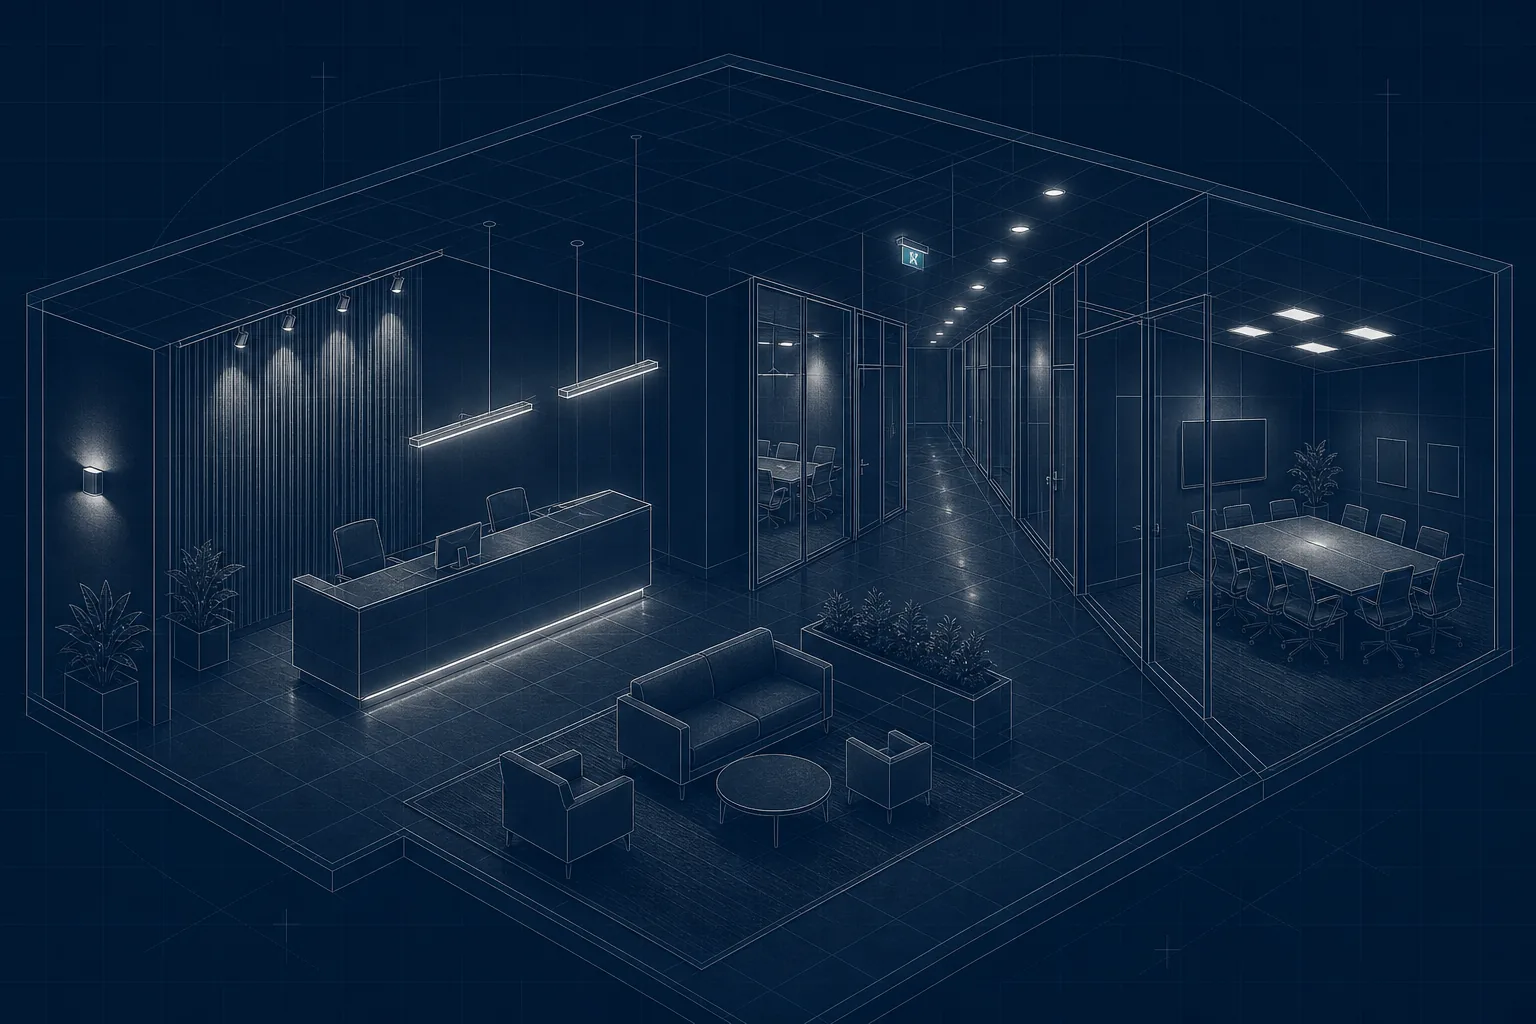
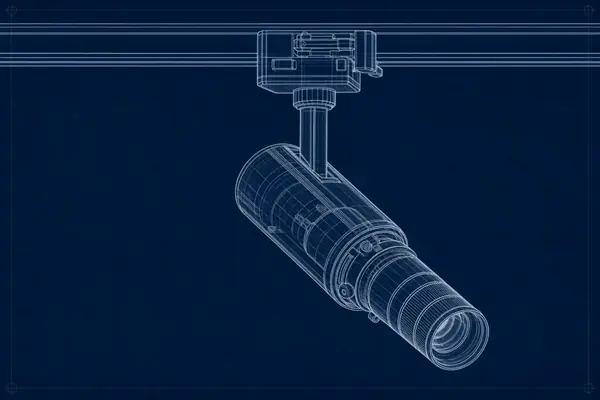
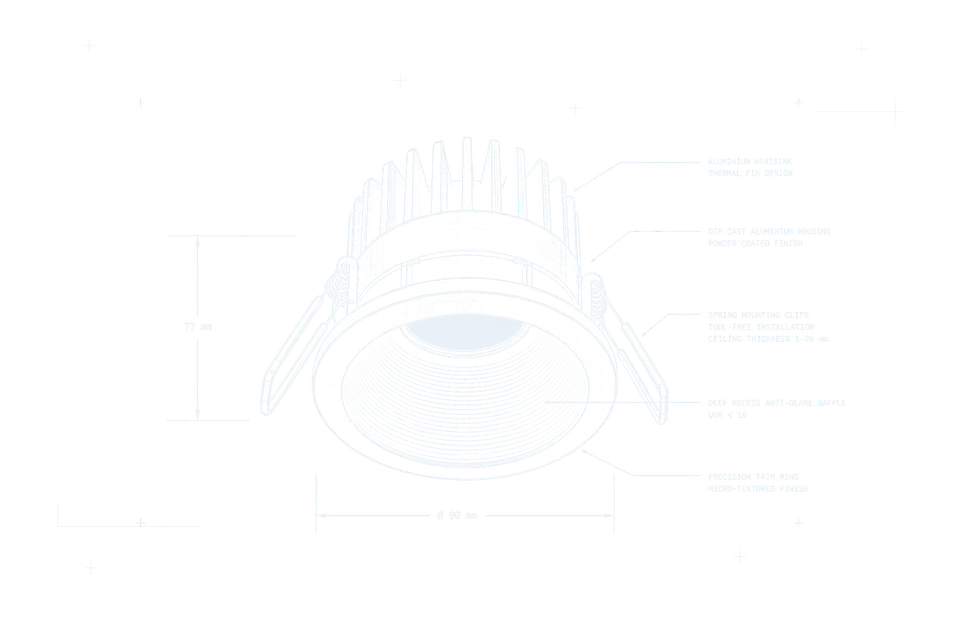
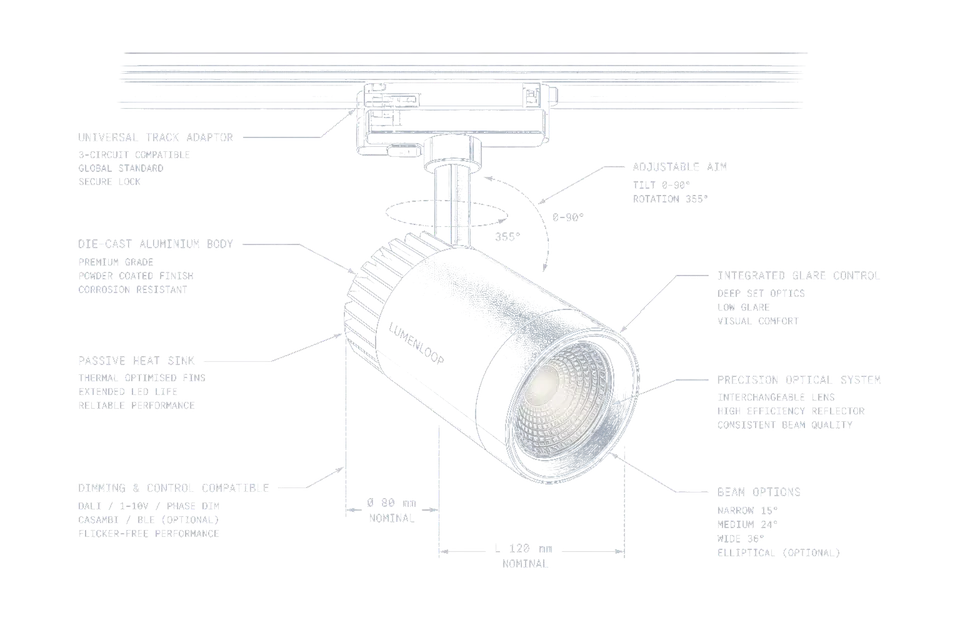
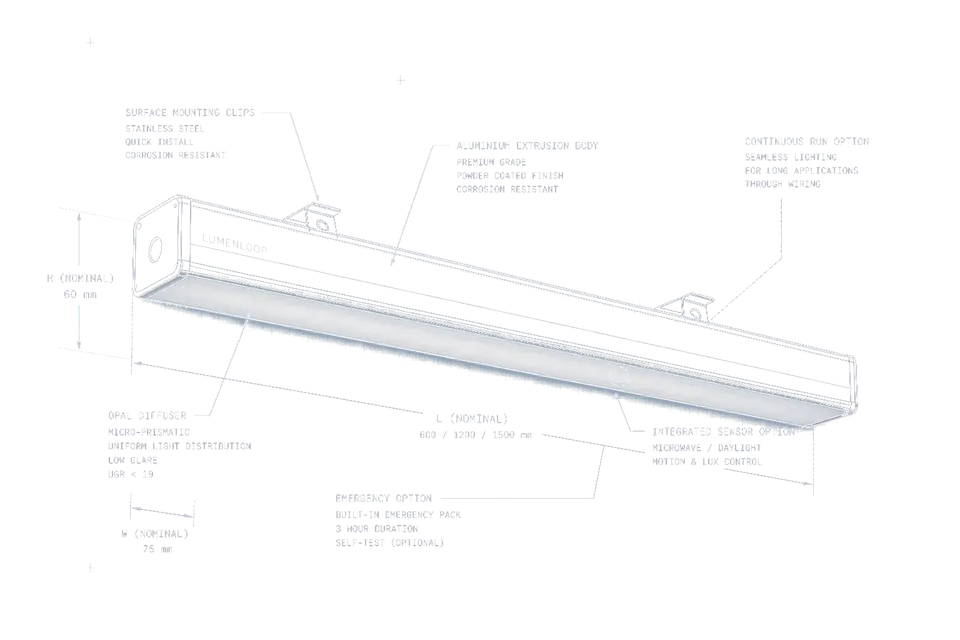
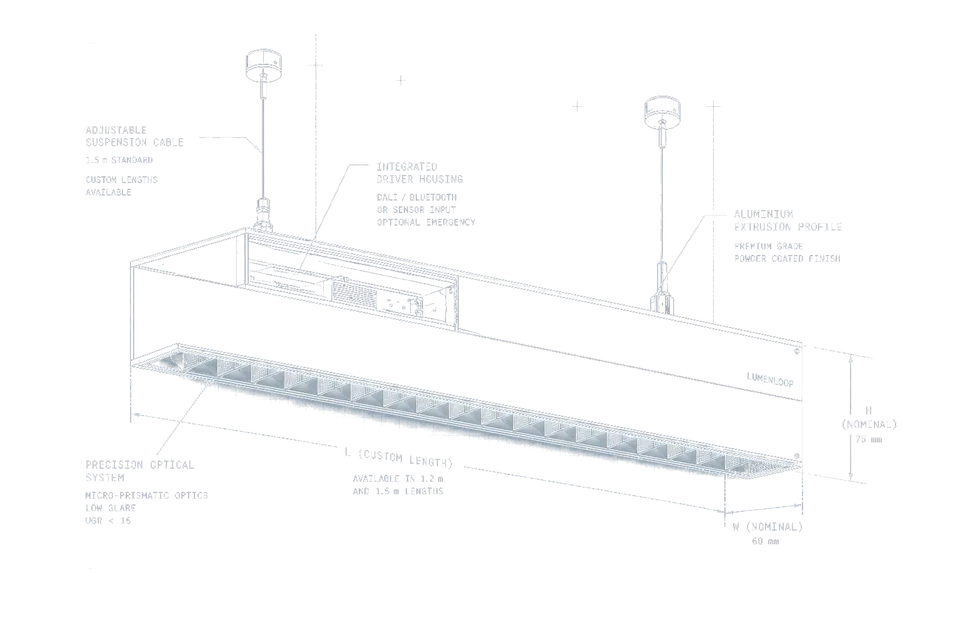
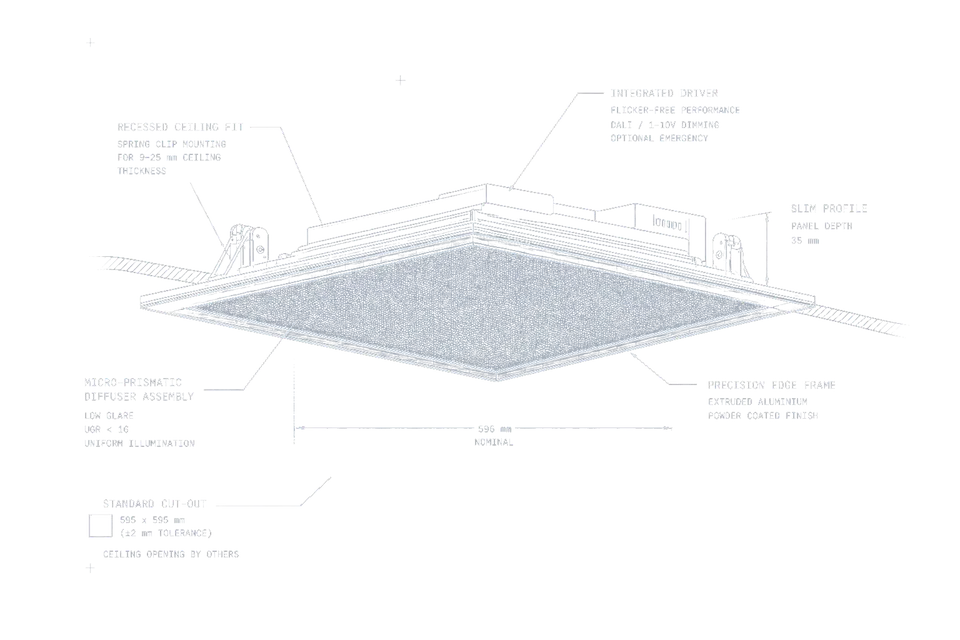
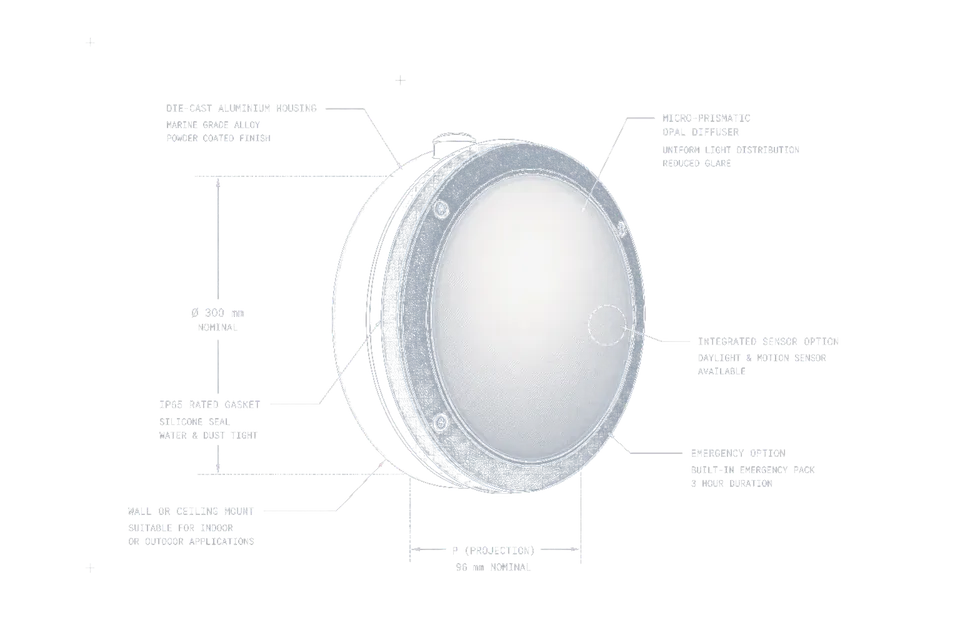
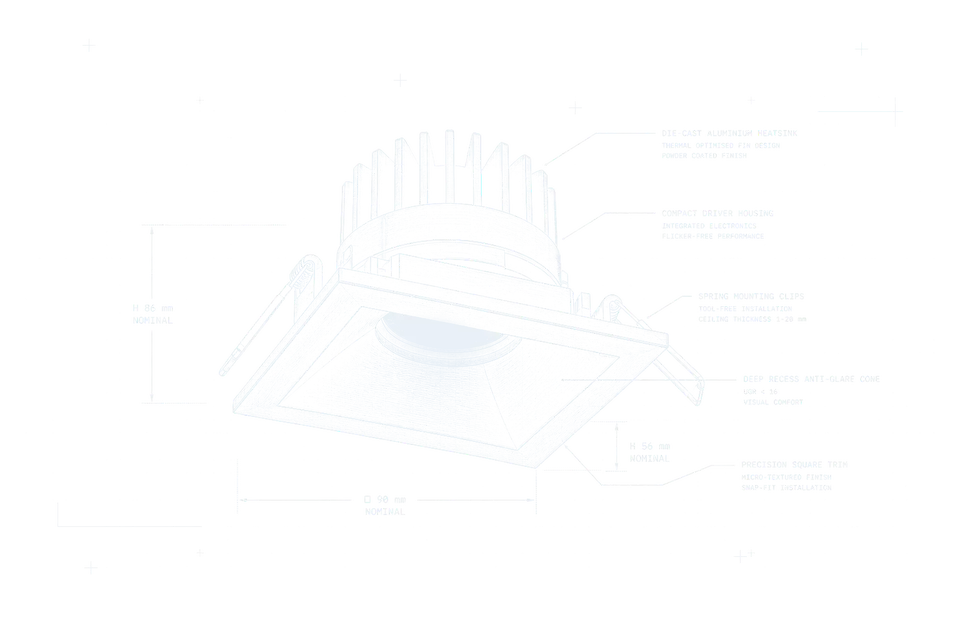
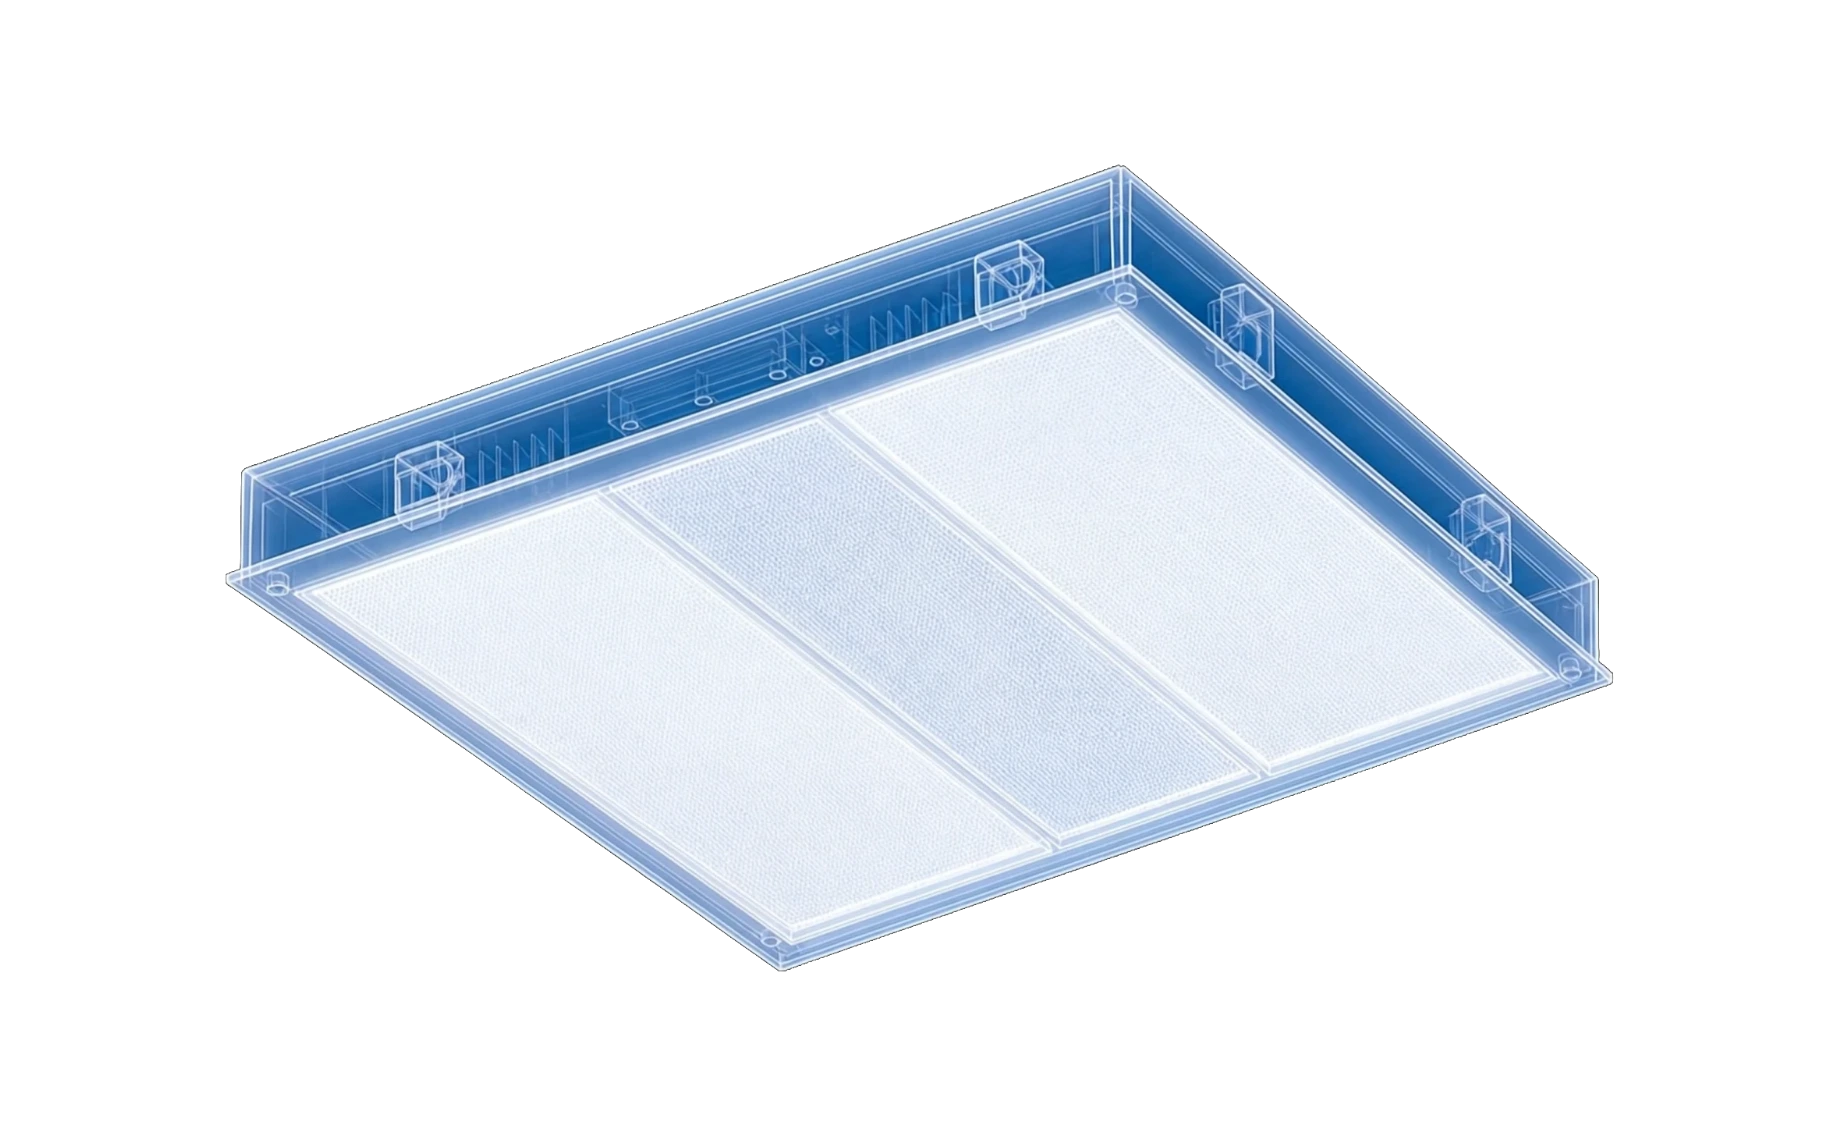
Match output, mounting type and finish to offices, corridors, retail floors, warehouses and commercial interiors.
CCT and colour quality
Set 3000K/4000K options and high-CRI profiles with beam angle for glare control and visual consistency.
Controls and accessories
Choose DALI, Casambi Bluetooth, mains dimming or fixed-output control gear where the selected luminaire supports it, plus emergency options and accessories.
Specification resources
Product ranges with datasheets, BIM files and photometry include technical files for commercial lighting specification.